Digital Camera Linearity
Digital cameras are based on CCD or CMOS detectors that are at heart linear photoconductive devices. If twice the flux of photons is received in a given pixel, twice the output value is obtained. This property makes it straightforward to composite bracketed sets of images to extend dynamic range (e.g. as discussed in the context of 16 bit imaging here).The linearity of digital camera sensors does have its limits. If too few photons are received during the course of an image exposure, the output value is dominated by various types of noise (read noise, dark current noise, etc.). The level of noise is intrinsic to the detector device, and its supporting electronics. Changing the gain (via the ISO setting) amplifies the digital values of this noise, making it more likely to dominate over real image data.
If too many photons are received during the course of the exposure, the capacitive well of the detector pixel "overflows", saturating at a fixed value. Alternatively, the output voltage sampling which turns measured photons into numbers encoded in the image file (the analog to digital convertor) can clip at its high end range, even before the pixel well is "full". This is called "digital saturation".
Example
We can directly test the linearity of a digital camera's CCD device by taking multiple exposures of a static scene with different shutter speeds, and comparing the resulting linear pixel values. The example images here are drawn from the bracketed image set from Flemming Larson, discussed here. This three image bracketed set was obtained at [1/30,1/8,1/2] second. Each was converted from RAW NEF file to linear 16bit TIFF by DCRAW, as described in the linked page.The following plots show the distribution of the ratio of pixel values from the Dark/Normal/Bright images, for each of red, green, and blue, as a function of the pixel value itself.
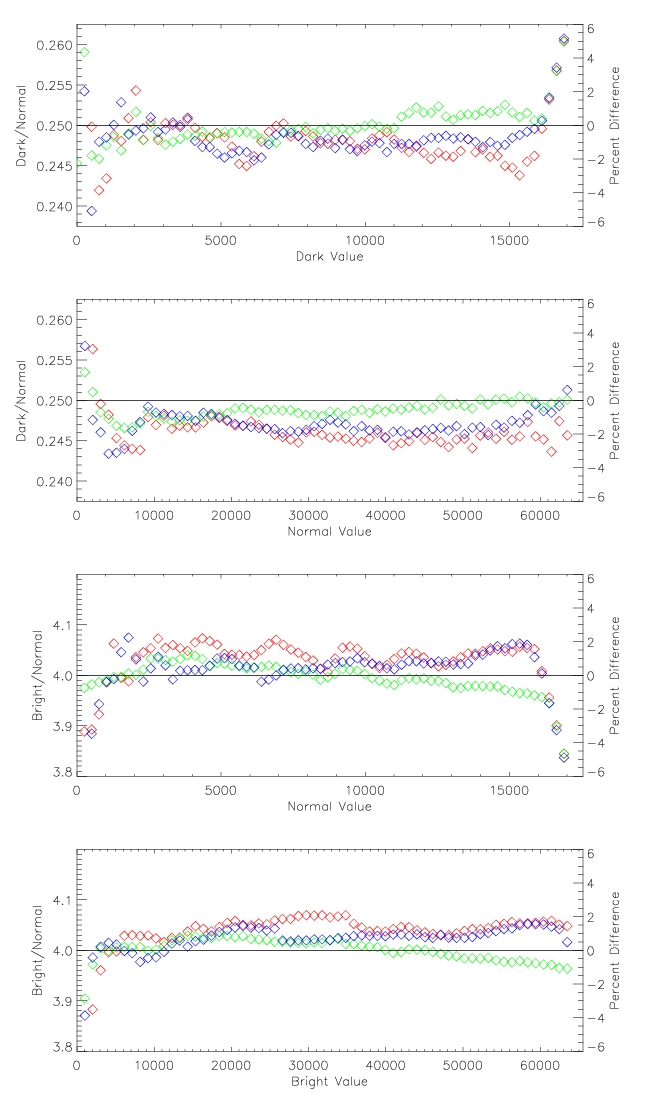
These plots show the median ratio of image pixels, binned by pixel value. The bin size is 1024 (out of 65536) for the 2nd and 4th plots, and 256 for the 1st and 3rd. When plotting against the darker image value, the brighter image reaches saturation at one quarter of the maximum range (16364). The first and third plots thus truncate the pixel value range. Above this value, the ratio diverges strongly. The horizontal lines are the expected ratios for perfect 2 stop changes in shutter.
From this plot you can see:
- All 3 images are very linear over almost the full range, diverging due to the (asymmetric) contributions of noise at lower values. Above this, they are linear within roughly 2% (note the right axis!).
- The green image (which constitutes from 1/2 of the total pixels in the Bayer mosaic) is the most close to linear for this camera, but the agreement is quite good for all 3 channels.
- The detector is linear all the way up to the digital limit, which suggests that this is digital, not physical saturation. When CCDs near physical saturation of their detector elements, they typically exhibit strong non-linearity. This means that there is more dynamic range available in these devices than is recovered by their 12 bit A/D electronics.
- The shutter speed reported in the image headers is not accurate, but is rounded to a nice round number (though why 1/32 is not nice, and 1/30 is is beyond me). For instance, the ratio of Dark/Normal should be (1/30 / 1/8), or 0.2666.
- The intensity ratios between adjacent images in the bracket series correspond quite closely to the 2EV offset, independent of what the shutter speed is. This makes it possible to extend the range available in a given image (set at the bright end by digital saturation, and at the dark end by the effects of noise) by combining multiple linear images of the same scene.
 Last modified: Mon Feb 19 13:28:23 MST 2007