
Mar 3, 2010
Latest AORs for the final program (Version 4):
Changes from V3->V4:
Code + inputs for AOR generation.
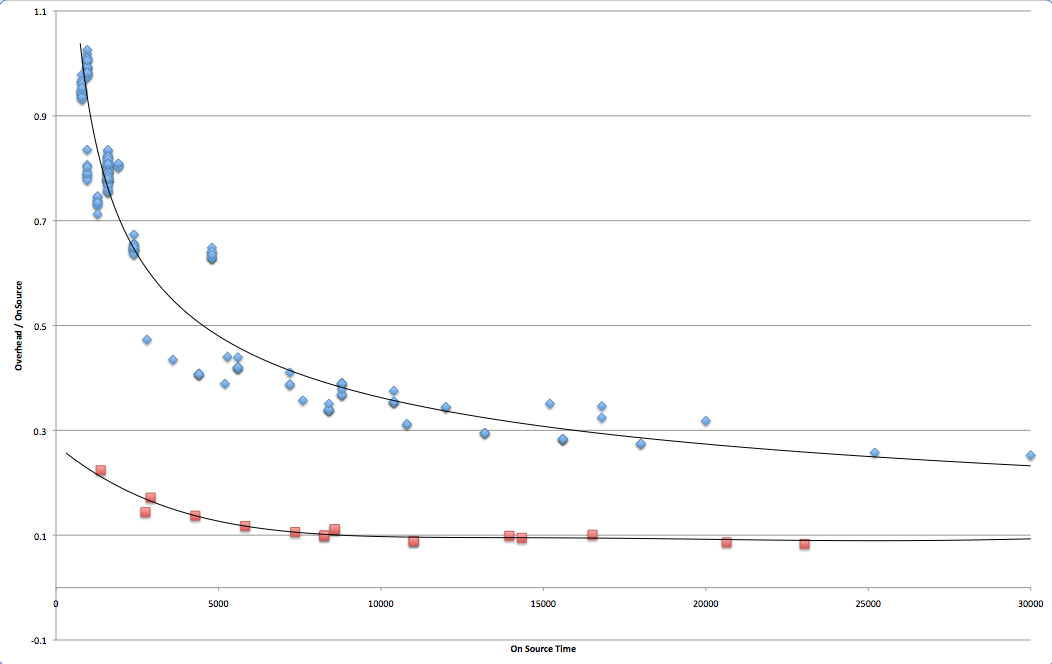
Overhead as a function of on source time, as reported by HSpot 4.4.4. Blue is wavelength switching (our actual V4 AORs) and red is chop-nod (simulated AORs that resemble ours mostly but have been extended to cover the low on-source time domain):
We have extracted 47"x47" regions from 3-band MIPS imaging of the full KP sample, targeting the nuclei, 55 extranuclear position (mainly HII regions), and radial strips designed to extend to a threshold TIR surface brightness. For 16 galaxies, radial strips are specifically excluded, since their SINGS LL strips yielded little or no useful extended information, or they are too large, and without Spitzer strip coverage (M33). The "dilution" factor was estimated directly from 24um maps, binned to PACS resolution, and obtains near 5. The distribution of TIR, regional dilution factor, and "corrected" TIR (modified by the dilution factor) are shown below:
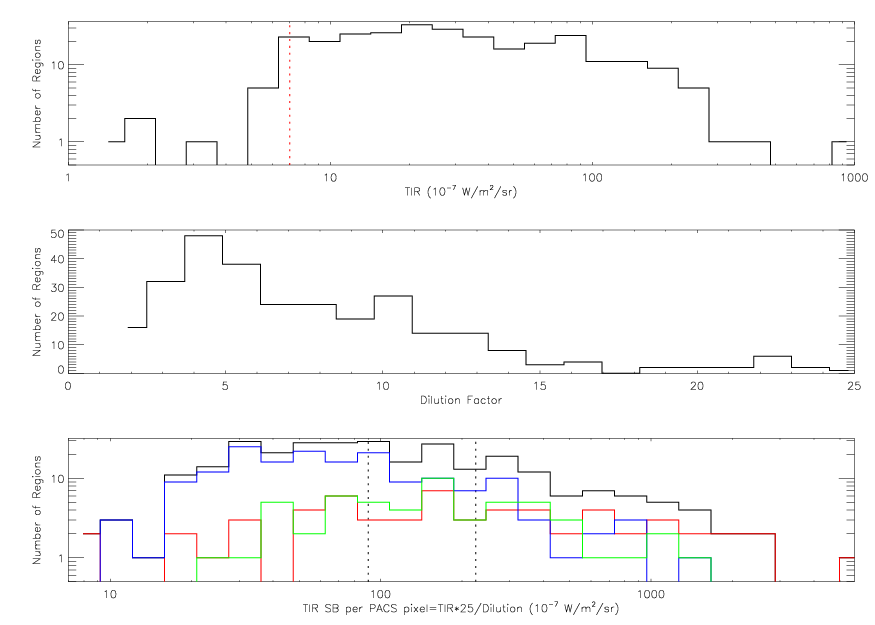 Red=Nuclei, Blue=Strips,
Green=Extranucs
Red=Nuclei, Blue=Strips,
Green=Extranucs
It can be seen that strip regions (blue) dominate the low-SB environment. The two dotted black lines denote the boundaries between SB bins (see below), and the red line denotes the SB cutoff limiting the outer radius of radial strips.
The data for nuclei, extra-nuclear regions, and the mean value of radial strips were placed into bins of corrected TIR SB. All objects in a bin are observed with the same number of PACS cycles. The lines considered are (in order of decreasing strength):
| Line | f(FIR) | RMS(PACS cycle) | Detection Speed |
|---|---|---|---|
| 1.e-3 | 1.e-18 W/m^2 | relative to [CII] | |
| [CII] 157um | 3 | 2.99 | 1.0000 |
| [OI] 63um | 2 | 12.91 | 0.0238 |
| [OIII] 88um | 1 | 7.94 | 0.0158 |
| [NII] 122um | 0.3 | 3.41 | 0.0077 |
| [NII] 205um | 0.2 | 8.27 | 0.0006 |
Options were considered for full strips, half strips, with graduated dropping of fainter lines for fainter bins, such that only [CII] and [OI] are observed in the first bin, adding [OIII] and [NII] in the middle, and adding [NII] 205 in the brightest bin. For all strips, the length was truncated at the outermost positions with above TIR above 7.e-7 W/m^2/sr.
Bins: Low: 0-90, Middle: 90-225, High: 225- (1.e-7 W/m^2/sr)
For each bin of SB, the number of cycles required to reach S/N=5 was set to target the midpoint of a bin, never assigning fewer than 3 cycles (below which overhead dominates). Where appropriate, lines of similar detectability were grouped together to realize additional overhead savings. Cycles required are an inverse quadratic function of line flux and spectrometer sensitivity.
Cycles used (per position):
| Line(s) | Low | Middle | High |
|---|---|---|---|
| [CII] | 3 | 3 | 3 |
| [OI] | 29 | 4 | 3 |
| [OIII] | 11 | 6 | 3 |
| [NII] (122) | 16 | 11 | 3 |
| [NII] (205) | -- | -- | 14 |
([NIII] 122 and [OIII] assumed brighter than TIR estimate, as below).
Full exposure time estimates for the sample (in cycles for a given line) are available here. Note that the mean surface brightness is used for the radial strip.
All times in hours. Old Estimates
 Low (0-90):
                 [CII]     [OI]   [OIII]    [NII] [NII]205
--------------------------------------------------------------------------
   nuc (14):      2.1     13.0      5.4      7.5      0.0  | Total:   28.1
  enuc (13):      1.9     12.1      5.0      0.0      0.0  | Total:   19.1
 strip (23):     11.9     88.0      0.0     49.9      0.0  | Total:  149.8
--------------------------------------------------------------------------
  Sub-total:     15.9    113.1     10.5     57.5      0.0            197.0

 Middle (90-225):
                 [CII]     [OI]   [OIII]    [NII] [NII]205
--------------------------------------------------------------------------
   nuc (15):      2.2      2.7      3.6      5.8      0.0  | Total:   14.2
  enuc (20):      2.9      3.5      4.7      7.8      0.0  | Total:   19.0
 strip (10):      6.1      7.6     10.7     18.4      0.0  | Total:   42.8
--------------------------------------------------------------------------
  Sub-total:     11.2     13.8     19.0     32.0      0.0             76.0

 High (225-):
                 [CII]     [OI]   [OIII]    [NII] [NII]205
--------------------------------------------------------------------------
   nuc (26):      3.8      3.8      3.8      3.8     12.4  | Total:   27.7
  enuc (17):      2.5      2.5      2.5      2.5      8.1  | Total:   18.1
 strip ( 0):      0.0      0.0      0.0      0.0      0.0  | Total:    0.0
--------------------------------------------------------------------------
  Sub-total:      6.3      6.3      6.3      6.3     20.6             45.8
==========================================================================
Grand Total:     33.5    133.2     35.8     95.8     20.6     ALL:   318.8
                 10.5%    41.8%    11.2%    30.0%     6.5%
--------------------------------------------------------------------------

  Nuc (55 gals):               70.0 (22.0%)
 Enuc (50 regs):               56.2 (17.6%)
Strip (33 gals, 148 regs):    192.7 (60.4%)
Click on the type name to see a list of galaxies and pointings in the
given bin. For radial strips, the number of strip pointings (excluding
the nucleus), and bin membership of the regions comprising the strip
(excluding the nucleus) are given.
The other possibility for foreground and background removal is chopping, but it has a maximum throw of 6 arcmin; not large enough for many galaxies in the sample. Wavelength switching is also ~2x faster than chopping, since the line is being observed at all times.
The ISM of the Galaxy has cirrus emission in [CII] and other lines (though likely weak in [OIII] and [NII]). Two types of foreground contamination can occur in wavelength-switched observations:
For direct contamination of the target line, wavelength switching is not sufficient. In these cases, chopping could be employed, if the source is small enough (and at some cost).
Galaxies which have foreground overlapping emission
Since we cannot control the placement or separation of the wavelength beams in the wavelength-switching mode, #2 will be unavoidable. However, in this case only one of the two beams is contaminated. If the S/N is sufficient for detection in both cases, the effect can be estimated and corrected.
Galaxies which have wavelength-switched "background" overlapping emission
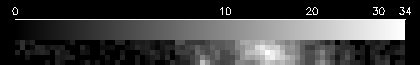
NGC 5055, simulated [CII] S/N map, sqrt scaling, 10.1" pixels.
The per-pixel fluxes of the far-infrared lines were estimated directly from SINGS measurements of [SiII], a bright PDR cooling line which scales well (in principle) with the FIR cooling lines. In SINGS, this line was obtained in long radial strip of approximately 1 arcmin x 2-12 arcmin. This method relieves all issues of direct conversion of TIR -> FIR lines w.r.t. source distribution and the "dilution factor" (see below), but introduces the additional scatter from the [SiII]/TIR relation (no useful direct comparisons of [SiII] to the FIR lines yet exists).
In the SINGS sample, a spread of [SiII]/TIR was found for the nuclei, ranging from 0.02%-0.25% , with a mean of:
[SiII]/TIR=0.13%(based on the PAHFIT nuclear fits of Smith et al., 2007).
The ISO Key project found a similar scatter in the FIR lines, with average values compared to FIR (note: not TIR) of (Malhotra et al., 2001):
| Line | Wavelength (um) | Line/FIR | HSPot RMS (Single cycle, 1.e-18 W/m^2) |
|---|---|---|---|
| [CII] | 157.741 | 3e-3 | 2.99 |
| [OI] | 145.52 | 2e-4 | 2.77 |
| [NII] | 121.90 | 3e-4 | 3.41 |
| [OIII] | 88.36 | 1e-3 | 7.94 |
| [OI] | 63.18 | 2e-3 | 12.91 |
Sensitivity updated as of 8/7/07.
An additional assumption of:
FIR/TIR=0.5was made (roughly consistent with the majority of Dale & Helou SEDs). Together, these three assumptions allowed scaling from a given surface intensity in [SiII] to any FIR line.
All SINGS LL1 maps were used to construct [SiII] line maps (69 galaxies total). The pixels were downsampled by a factor of 2, to 10.16" (slightly larger but comparable to PACS 9.4" spectrograph pixels). The sensitivity in each of the lines of interest was computed based on HSpot single cycle chopping estimates, but there is little change for wavlength-switching observing modes (aside from the time savings to complete a cycle).
The downsampled [SiII] maps were then converted into S/N maps for each line, and the 5x5 pixel region surrounding the nucleus was searched for the pixel with the maximum S/N. Note that since the PACS spectrograph is severely undersampled, 1 pixel = ~1 point source for most lines (slightly larger for >120um). The integer number of maps cycles required to obtain at least S/N=5 on that brightest pixel was computed.
For each line, the maximum pixel S/N, the mean S/N within one PACS field centered on the nucleus (roughly), and the number of cycles required to achieve S/N=5 are given.
For the brightest lines in the sensitive parts of PACS' wavelength coverage, most of the SINGS sample can be observed in 5 or fewer cycles. The fainter lines are unobtainable in larger fractions of the sample (the faintest covers only 17% to a modest limit of 20 cycles). Obviously these estimates give no consideration to FIR lines to [SiII] or TIR falling at the extremes of their distribution.
 [CII] 158: 93% (64 galaxies) < 20 cycles; mean= 1.69 cycles: 12.0hrs Strip Map:  53.6hrs
  [OI] 146: 54% (37 galaxies) < 20 cycles; mean= 4.73 cycles: 19.4hrs Strip Map: 114.6hrs
 [NII] 122: 88% (61 galaxies) < 20 cycles; mean= 2.46 cycles: 16.7hrs Strip Map:  78.7hrs
[OIII]  88: 71% (49 galaxies) < 20 cycles; mean= 3.73 cycles: 20.3hrs Strip Map: 125.6hrs
  [OI]  63: 75% (52 galaxies) < 20 cycles; mean= 3.19 cycles: 18.4hrs Strip Map: 103.0hrs
[NIII]  57: 17% (12 galaxies) < 20 cycles; mean= 5.17 cycles:  6.9hrs Strip Map:  40.1hrs
 93.8hrs total (single, nuclear position only)
515.4hrs total (strip, LL double coverage radius)

Point source dilution factor: 0.26 +- .08

Point source dilution factor: 0.31 +- .07
Here we develop the "dilution factor" to approximate this effect. We assume that [CII] and other FIR lines are distributed spatially roughly in the manner that [SiII] is. We use the SINGS LL radial strip maps of [SiII], binned to 10.16" pixels. Overlain are 7 50"x50" fields similar in size to the PACS field. In each field, the peak point source to total flux ratio is measured. A single point source dominating the field corresponds to a dilution factor of 1.0. A uniformly extended source corresponds to a dilution factor of 4/25=.16 (1/number of spatial elements in on PACS field).
MIPS fluxes, measured in a 48"x48" aperture:
70um: 236MJy/sr, 13Jy
160um: 580MJy/sr, 31Jy
S/N 10 (point source)
57-105um: 3hrs
105-210um: 1.5hrs
Total: 4.5hrs
With a pessimistic "dilution factor" of 0.25:
57-105um: 45hrs
105-210um: 23hrs
Obvious areas to explore are the assumed dilution factor and PSF in the guesstimator, coadding for lowered resolution (to R~500 or below) and higher S/N.